


How To Make Better Business Decisions with a Reporting Pyramid

In order for you to be able to make informed decisions and remain competitive in your business, you need to be accessing real time data and insights. Having a strong reporting framework is more important than ever. A reporting framework will enable you to capture all the data on a regular basis that is important to your business and keep you on track with your strategic goals.
In this blog post, we will explore the importance of having a strong reporting framework and how Nine Advisory uses reporting pyramids with our clients to break down reporting into daily, weekly, fortnightly, monthly, quarterly, and annual reporting.
Why is having a strong reporting framework important?
A strong reporting framework is important for several reasons.
Firstly, it provides you with the data you need to make informed decisions. Without a strong reporting framework, you are operating in the dark and are not able to see the bigger picture or the detail about what’s happening across your business.
Secondly, a strong reporting framework helps you to identify trends and patterns in the data. By analysing data over time, you can identify areas where the business is performing well and areas that need improvement.
Thirdly, a strong reporting framework helps your business monitor performance against key performance indicators (KPIs). This allows you to identify areas where the business might be falling behind and take action to address the issues.
Most importantly, the framework is forward looking, in real-time and saves you money BEFORE mistakes or opportunities are left too long and become increasingly costly. If we can identify that your wages % is 2% too high in the first week of the month, we don’t have to wait until the 2nd week of the next month (4 weeks of mistakes later) when we meet to realise that this has happened.
How Nine Advisory uses the reporting pyramid
At Nine Advisory, we use a reporting pyramid to break down reporting into a series of frequencies. Below is an example of our framework.
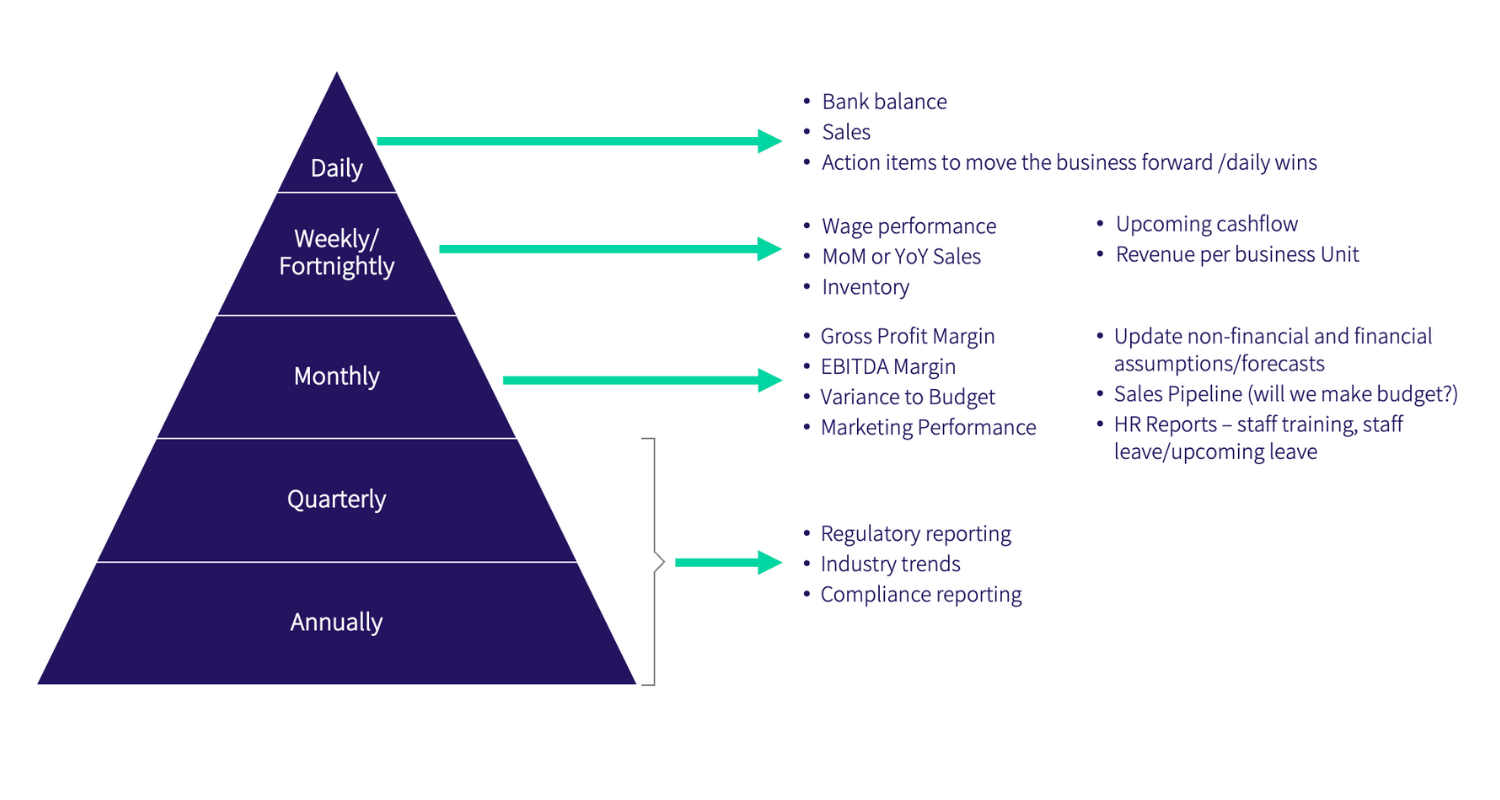
The reporting pyramid consists of six reporting frequencies: daily, weekly, fortnightly, monthly, quarterly, and annual.
Daily reporting
Daily reporting is used to monitor performance on a day-to-day basis. Examples of data that could be looked at for daily reporting include revenue or sales, daily margins, revenue per head or per customer, and customer satisfaction ratings.
Weekly reporting
Weekly reporting is used to monitor performance on a weekly basis. Examples of data that could be looked at for weekly reporting include wages as a percentage of sales, cost of goods sold as a percentage of sales, and employee turnover rates.
Fortnightly reporting
Fortnightly reporting is used to monitor performance every two weeks. Examples of data that could be looked at for fortnightly reporting include supplier performance ratings, inventory turnover rates, and website traffic.
Monthly reporting
Monthly reporting is used to monitor performance on a monthly basis. Examples of data that could be looked at for monthly reporting include cash flow forecasts, sales pipeline reports, and customer retention rates.
Quarterly reporting
Quarterly reporting is used to monitor performance on a quarterly basis. Examples of data that could be looked at for quarterly reporting include profit and loss statements, balance sheets, and cash flow statements.
Annual reporting
Annual reporting is used to monitor performance on an annual basis. Examples of data that could be looked at for annual reporting include financial statements, audit reports, and performance appraisals.
How You Can Action This in Your Small Business
Implementing a reporting framework in your small business can seem daunting, but it doesn't have to be. The first step is to identify the key data points that are important to your business. These will vary depending on the nature of your business, but could include things like sales, revenue, customer satisfaction ratings, and employee turnover rates.
Once you have identified the key data points, you can start to build a reporting framework around them. This could involve setting up spreadsheets or dashboards to track the data and create visual representations of it. Decide how often you would like to report on each metric using the example framework above.
The key to implementing a reporting framework successfully is to make it as simple and easy to use as possible. This could involve automating data collection and analysis wherever possible, or providing training to staff to implement the rhythm of reporting.
Examples for Reporting
Below are some other types of data points that might be relevant to your business.
Daily Reports:
Number of calls made by sales representatives
Customer service call volume and response time
Website traffic and user engagement metrics
Inventory levels and stock replenishment needs
Production outputs and manufacturing cycle times
Weekly Reports:
Sales by product or service category
Marketing campaign performance and return on investment (ROI)
Accounts payable and receivable aging reports
Employee time and attendance
Customer feedback and complaints
Fortnightly Reports:
Social media engagement metrics and performance
Supplier performance ratings and delivery times
Operational efficiency metrics such as lead times and quality metrics
Equipment maintenance schedules and updates
Monthly Reports:
Profit and loss statements and cash flow statements
Budget versus actual performance analysis
Customer retention and churn rates
Sales pipeline reports and conversion rates
Employee performance reviews and goal tracking
Quarterly Reports:
Balance sheets and income statements
Sales by customer or market segment
Market share and competitive analysis
Business plan progress and updates
Employee satisfaction and engagement surveys
Annual Reports:
Financial statements and audit reports
Regulatory compliance reports
Stakeholder updates and progress reports
Capital expenditure plans and investment strategies
Environmental and social responsibility reporting
It's important to note that the specific reports that you choose to implement will depend on your industry, size, and unique needs.
This reporting pyramid is a framework we use for all our clients. If you are interested in finding out how Nine Advisory can help you to create Success on Purpose, please contact us.

